The Dagster Project, Visualization for Social Data Science, Forecasting with Linear Regression
This week's agenda:
Open Source of the Week - The dagster project
New learning resources - Forecasting with linear regression, multi-model LLM, multiprocessing with Python
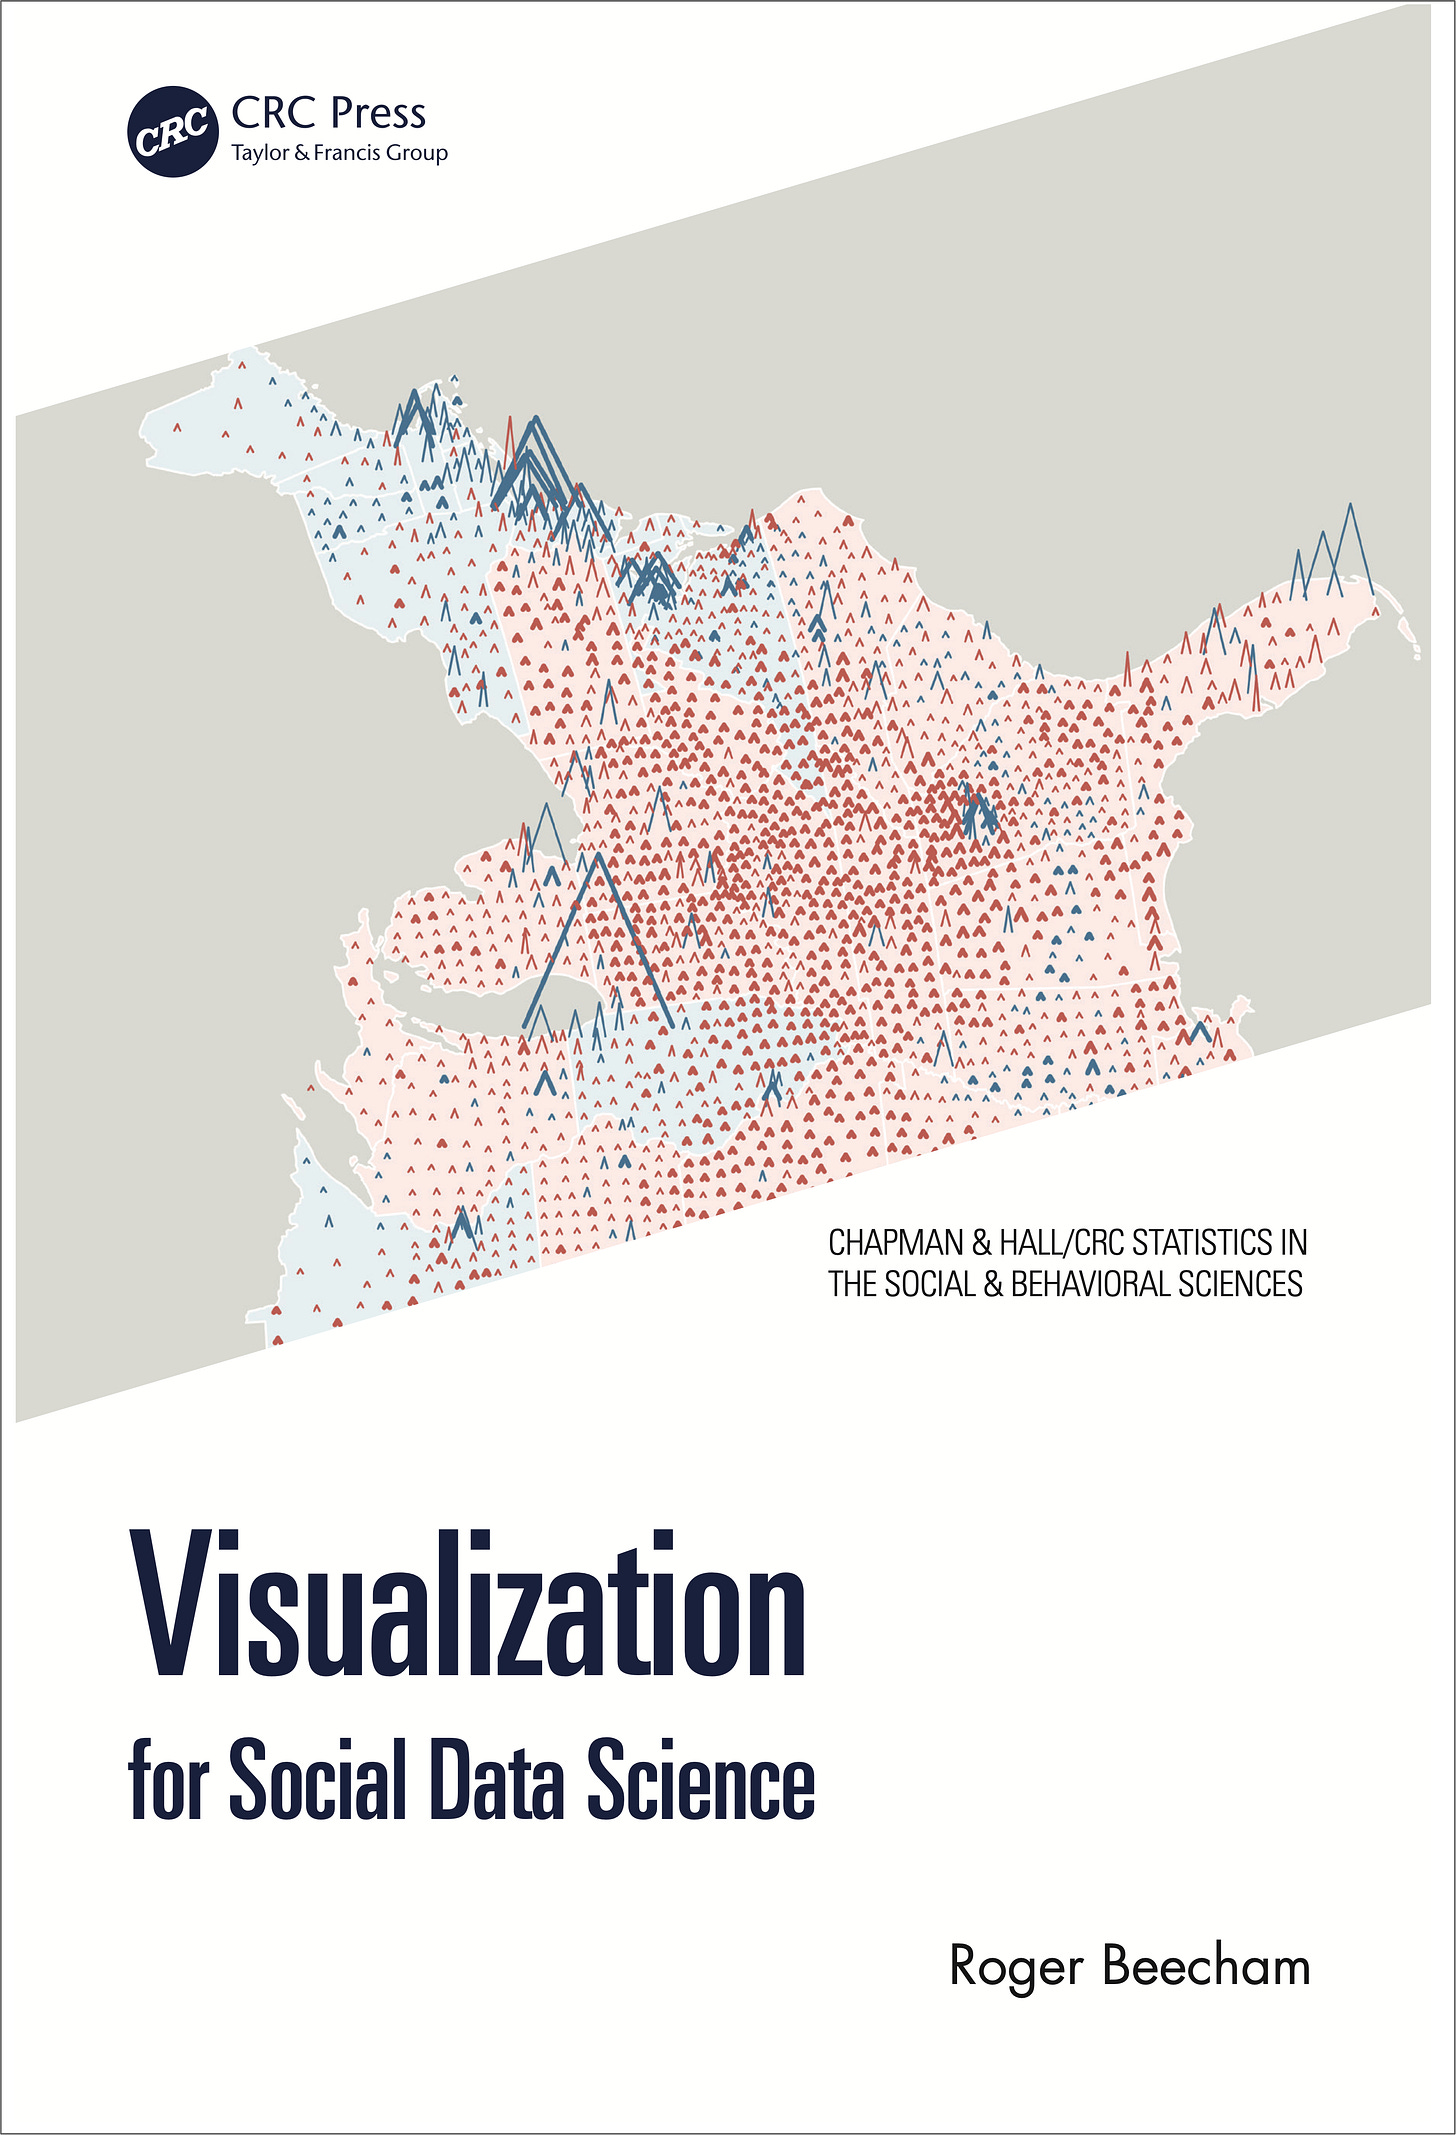
Book of the week - Visualization for Social Data Science by Roger Beecham
I share daily updates on Substack, Facebook, Telegram, WhatsApp, and Viber.
Are you interested in learning how to set up automation using GitHub Actions? If so, please check out my course on LinkedIn Learning:
Open Source of the Week
This week’s focus is on a data engineering open-source project - dagster. The dagster project by Dagster Labs is an orchestration framework for data ETL and pipeline automation.
Highlights and Key Features
Software-defined asset and asset graphs - Define data assets (tables, files, ML models) as Python functions using assets, building a declarative, typed graph with lineage and dependency tracking
Integrated observability and lineage - Provides metadata-aware monitoring: data freshness, column-level lineage, and performance logging all out of the box
Dev lifecycle - Supports local development, unit/integration testing, branch environments, and production deployment. Uses SQLite by default for local metadata, with optional Postgres support for serious workloads
Modular and reusable components - Promotes software engineering best practices with reusable “ops,” resources, sensors, schedules, and strong CI/CD compatibility
Rich integrations - Native connectors for tools like dbt, Snowflake, S3, Kubernetes, Databricks, GitHub, etc.
Scalability and execution flexibility - Runs pipelines locally or scales across environments using parallel, distributed executors and partitioning strategies
Project repo: https://github.com/dagster-io/dagster
You can read more about it in the project documentation.
License: Apache 2.0
New Learning Resources
Here are some new learning resources that I came across this week.
Forecasting with Linear Regression
I had the pleasure this week to present at the R-Ladies Rome meetup about forecasting with linear regression. This workshop covered the following topics:
Time series decomposition
Correlation and seasonal analysis
Modeling trend and seasonality
Using piecewise regression to model change in trend
Residuals analysis
Notebooks are available on the workshop repo:
https://github.com/RamiKrispin/r-ladies-rome-workshop
Multi-model researcher with Gemini 2.5 and LangGraph
The following tutorial provides an example of setting up a multi-model researcher using Gemini 2.5 and LangGraph.
Multimodal Embedding with RAG
The following tutorial from the Prompt Engineering channel provides an introduction to multimodal embedding that can handle text, images, code, and tables.
Python Multiprocessing
A short tutorial about multiprocessing in Python using the multiprocessing library.
Book of the Week
This week's focus is on a data visualization book - Visualization for Social Data Science by Roger Beecham. The book, as the name implies, focuses on using data visualization in social science using R. It blends theory, code, and compelling examples to demonstrate how data visualization and modern statistical methods work together in social science research.
Topics covered include:
Data fundamentals: strategies for preparing and wrangling diverse social datasets
Visualization theory and grammar: understanding marks, channels, and the grammar of graphics for clearer storytelling
Exploratory data analysis: hands-on workflows to reveal structure and relationships in real-world data
Advanced geo-visuals and networks: maps, cartograms, geographic flow maps, glyphmaps, and network plots coded in ggplot2
Model integration: overlaying models and uncertainty into visualizations to highlight meaningful patterns
Uncertainty visualization: techniques to represent confidence, variability, and reliability in social data
Visual storytelling: crafting narratives with data through structured, principled design
Reproducible workflows: use of R/Quarto, tidyverse, and literate programming to build shareable, transparent analysis pipelines
This book is ideal for social scientists, data journalists, and researchers (especially in Geography, Public Health, Transportation, and Political Science) with some R experience who want to raise their visualization and analytic rigor.
The book, thanks to the author, has an open and free online version, and a hard copy can be purchased via the publisher's website.
Have any questions? Please comment below!
See you next Saturday!
Thanks,
Rami


