Marimo Extension to Quarto, Health Metrics and the Spread of Infectious Diseases, New Tutorials
This week's agenda:
Open Source of the Week - Marimo extension to Quarto
New learning resources - LLM and transformers workshops, 3D maps with Rayshader, setting up DAG with Airflow 3, Bayesian time series, intro to time series with Python
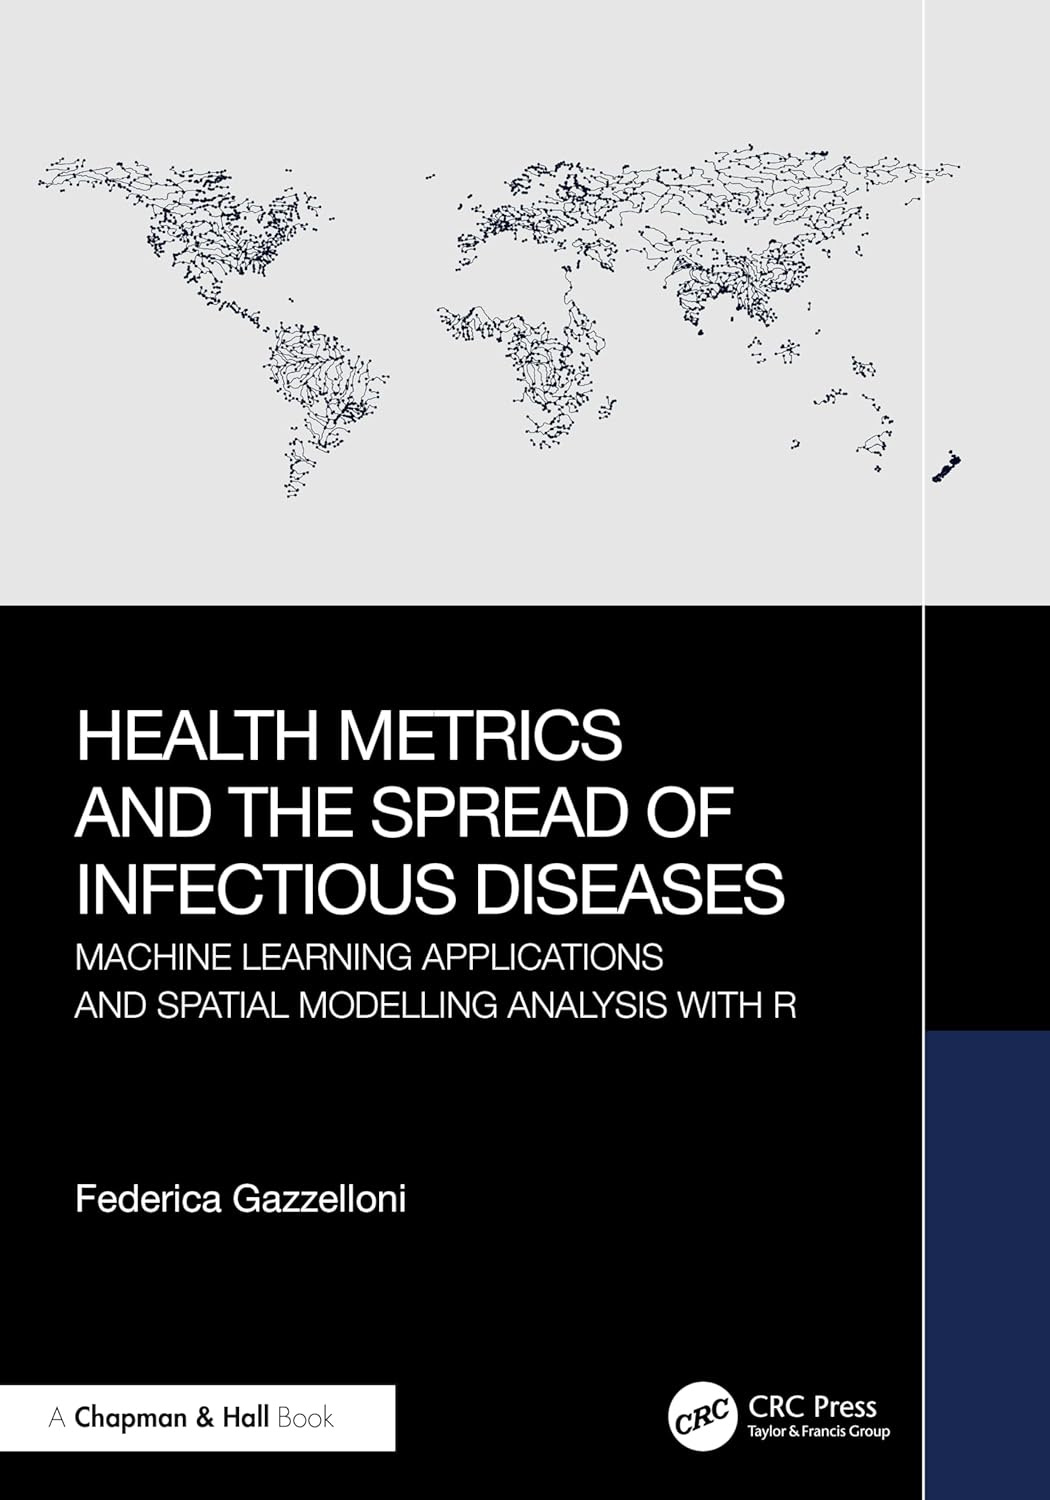
Book of the week - Health Metrics and the Spread of Infectious Diseases by Federica Gazzelloni
I share daily updates on Substack, Facebook, Telegram, WhatsApp, and Viber.
Are you interested in learning how to set up automation using GitHub Actions? If so, please check out my course on LinkedIn Learning:
Open Source of the Week
If an Observable notebook gets married to a Jupyter notebook, their kid would be a Marimo notebook. Marimo is a super cool open-source project that provides a reactive Python notebook. This week's focus is on the Marimo extension to Quarto.
Quarto‑Marimo is a new extension from the Marimo team that adds reactive features of Marimo notebooks directly into Quarto documents. It enables interactive, dependency-aware Python execution within markdown, without requiring a full notebook setup or manual cell running.
Project repo: https://github.com/marimo-team/quarto-marimo
Key Features & Highlights
Reactive Python cells within .qmd files allow you to write Python directly inside Quarto markdown blocks. Marimo intelligently re‑executes only the dependent cells when variables change—no need to run all.
Seamless Quarto integration Embeds Marimo’s reactive “islands” into Quarto, enabling live code examples that readers can modify and re-run in static HTML output.
Developer-friendly Combines Marimo's strengths—such as pure-Python notebooks, git-friendly formats, and script compatibility—with Quarto's publishing capabilities. This makes it easy to create interactive documentation, blogs, tutorials, or dashboards.
The following video by Jeroen Janssens and 👋 Vincent D. Warmerdam provides an introduction to Marimo and the Quarto extension:
More details and tutorials are available on the project documentation.
License: Apache 2.0
New Learning Resources
Here are some new learning resources that I came across this week.
Mastering LLMs: From Prompt Engineering to Agentic AI
The following workshop from the PyData Virginia 2025 conference provides an introduction to LLMs, and it covers the following topics:
Introduction to prompt engineering
Retrieval-augmented generation (RAG)
Agentic AI design
Fine-tuning strategies
Model evaluation methods
Evolution of the Transformer Architecture Used in LLMs
The following course by Imad Saddik introduces the latest advancements that have enhanced the accuracy, efficiency, and scalability of Transformers. The course is beginner-level, and it covers the following topics:
Various techniques for encoding positional information
Different types of attention mechanisms
Normalization methods and their optimal placement
Commonly used activation functions
Setting Up DAG with Airflow 3
The following tutorial by Marc Lamberti provides a step-by-step guide for setting up a DAG with Apache Airflow 3.
3D maps with Rayshader
A great playlist from Milos Popovic, PhD about creating 3D maps with Rayshader with R. This series of 24 videos covers different techniques for 3D mapping, such as relief, elevation maps, and hex maps using tools such as ggplot2, rayshader, and Google maps.
Bayesian Time Series
This tutorial by Christopher Fonnesbeck introduces Bayesian time series analysis with PyMC, covering models like ARIMA, dynamic linear models, and stochastic volatility models.
Intro to Time Series
The following tutorial by Jorn Mossel provides an introduction to time series forecasting with Python. This includes both traditional methods and machine learning forecast approaches.
The Data Council 2025 Conference
All the talks from the Data Council 2025 Conference are now available to watch.
Book of the Week
This week's focus is on an epidemiology data science book. The Health Metrics and the Spread of Infectious Diseases: Machine Learning Applications and Spatial Modelling Analysis with R by Federica Gazzelloni, as the name implies, provides an introduction to the analysis and modeling of disease spread with R.
The book covers the following topics:
Overview of public health metrics: Learn how to calculate DALYs, YLLs, YLDs, and more—with clear explanations of their components
Machine learning integration: Covers creating and evaluating predictive models in R using frameworks like tidymodels and INLA
Data visualization techniques: From ggplot2 to leaflet and sf, you'll explore examples for mapping and interpreting infectious disease patterns
Hands-on code examples: Step-by-step tutorials and complete scripts help you replicate case studies and apply tools yourself.
Spatial and temporal analysis of outbreaks: Investigates real-world cases like COVID‑19 and malaria, emphasizing spatial epidemiology
Reproducible workflows and the hmsidwR package: Includes guidance on reproducible research with Quarto and offers a dedicated R package for easy replication
This book is ideal for early-career practitioners, graduate students in public health, epidemiology, or data science. This book provides a practical toolkit for analyzing and visualizing health metrics in R with real-world applicability.
The book, thanks to the author, has a free online version, and a printed version is available for purchase on Amazon.
Have any questions? Please comment below!
See you next Saturday!
Thanks,
Rami


